LEADERSHIP / STRATEGY / UX
Design System Architecture
Role
Overview
Web.com’s history of acquiring companies has resulted in a diverse product portfolio. Once a company has multiple software products, the arguments for a design system are overwhelming — they allow better experiences to be built more rapidly at a lower cost.
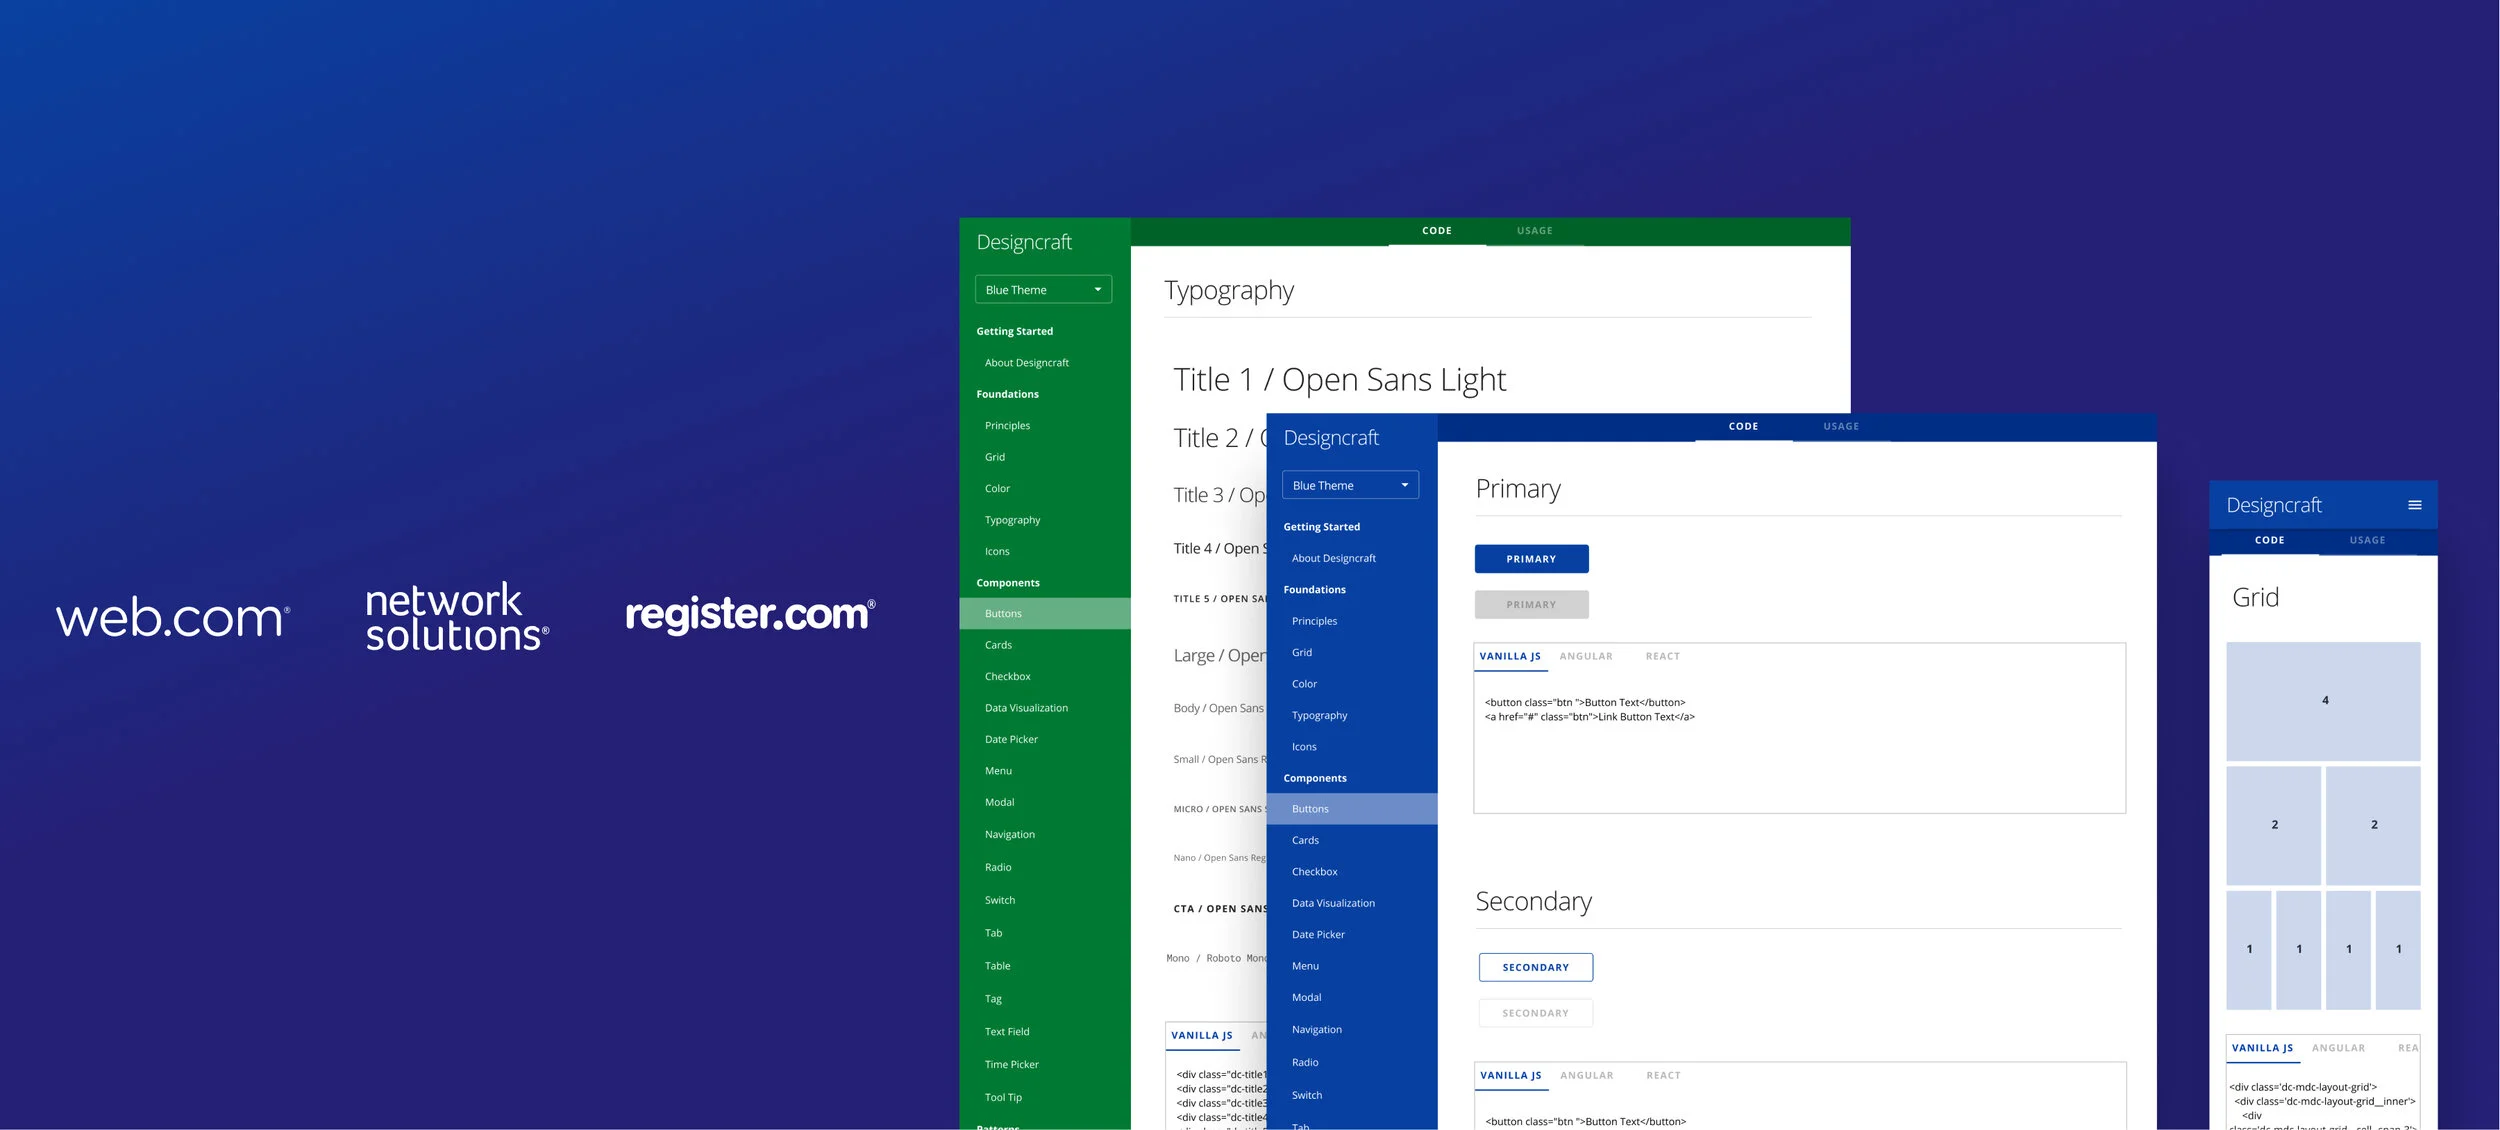
The company attempted to create a design system before but it didn’t gain adoption. Using strategic design leadership, I drove numerous designers and developers to create a design system to service the needs of various teams across the company.
Learn
Surveys were sent out across the organization and I facilitated workshops with key members of more than 10 product teams to discuss their design and development process and their history with design systems.
Product designers conducted an audit across Web.com’s product portfolio to gain an understanding of the variations in UI, UX and tech stacks. They also ran an analysis of the many design systems being used by other companies.
Listening session to understand what designers, engineers and product think of design systems.
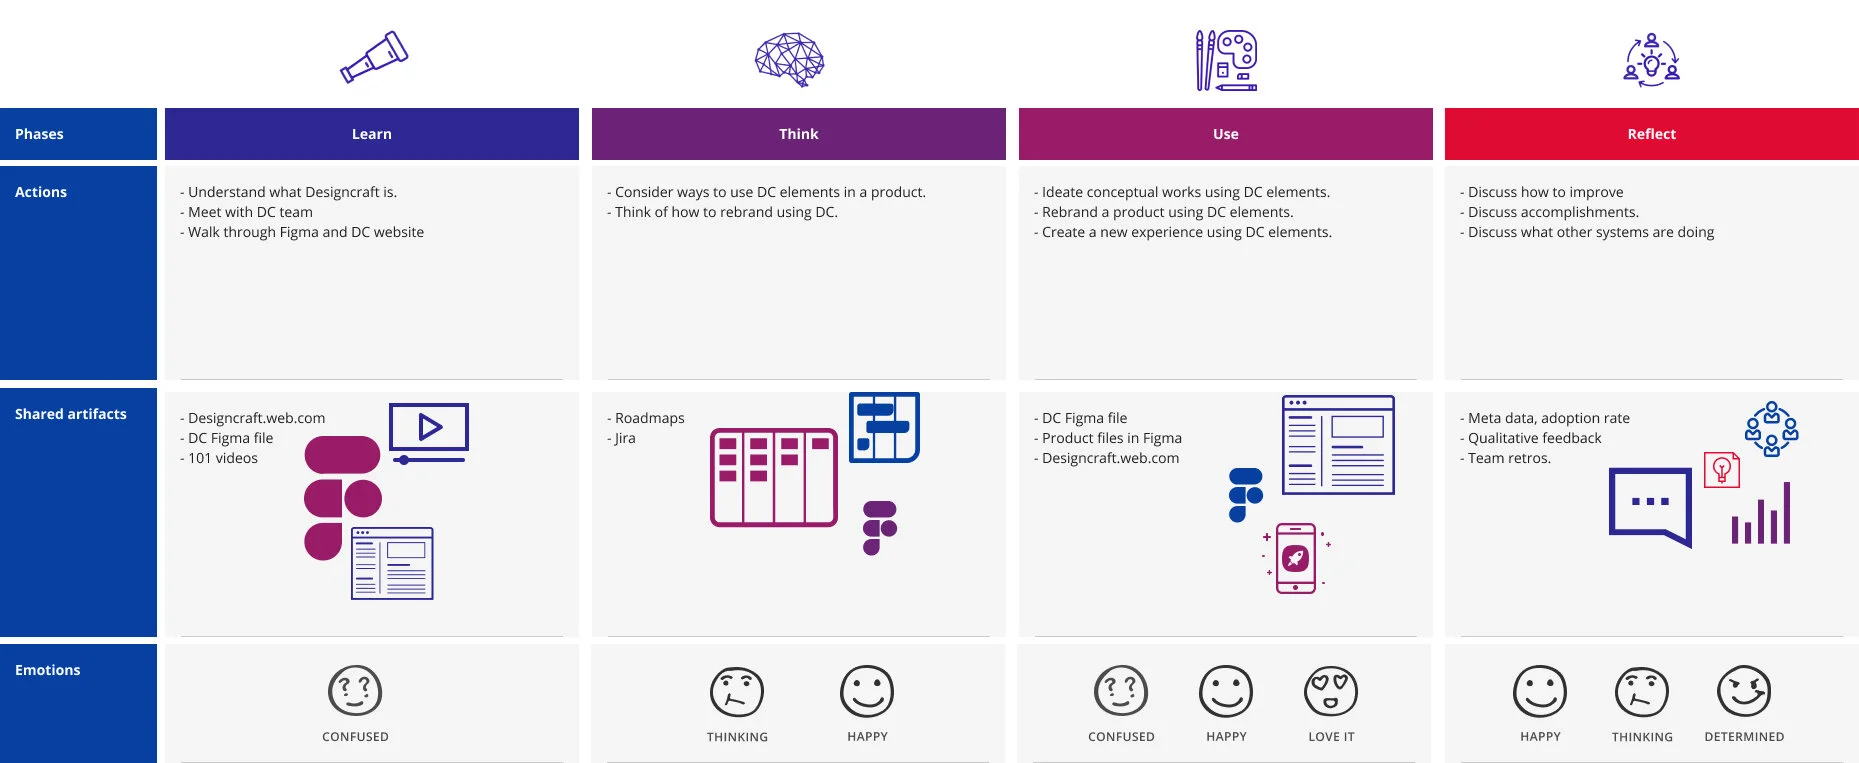
Experience map of people interacting with Designcraft.
By analyzing the formative data, I hypothesized that successful design systems are not just based on components and tech stack, success is strongly tied to how teams interact with the system on a continuous basis. There was an opportunity to increase the quality and speed at which we make products if teams used highly reusable assets, leaving room for them to solve complex business issues.
Web.com’s teams were not empowered to produce high quality brand-aligned, system-minded products.
Many successful design systems are created when dedicated multidisciplinary teams build with simple, reusable, accessible components. It is also important to pair designers and developers together as they create the system. With a part-time resource of designers and developers, I hypothesized that Web.com could create an MVP of the design system within 3 months.
Strategy
Think
I facilitated a brainstorming workshop where this blended team of designers, engineers, and managers were tasked to create a list of Design System fundamentals.
The group set out to align with a 3-month scope and to meet the business and experience needs of over 15 product teams.
During a brainstorming session, we used Affinity Mapping to categorize the ideas of Designcraft’s principles.
Device Agnostic
Designing for multiple screen sizes would create a large product backlog. To reduce the scope of work we decided to make our components as device agnostic as possible.
Simple
In order to increase the likelihood of adoption across the 15+ product teams, the components of the system must be simple in design and documentation.

Modular
Successful systems have highly modular elements. Components for DC will be reused in multiple contexts and they should not be tied to single use cases.
Make

A project roadmap was created.
Assigned individual contributors components to build for the MVP.
To ensure that the behavior of Designcraft elements was logical from a UX and engineering standard, designers were paired with developers when they built components.
Weekly design critiques were held.
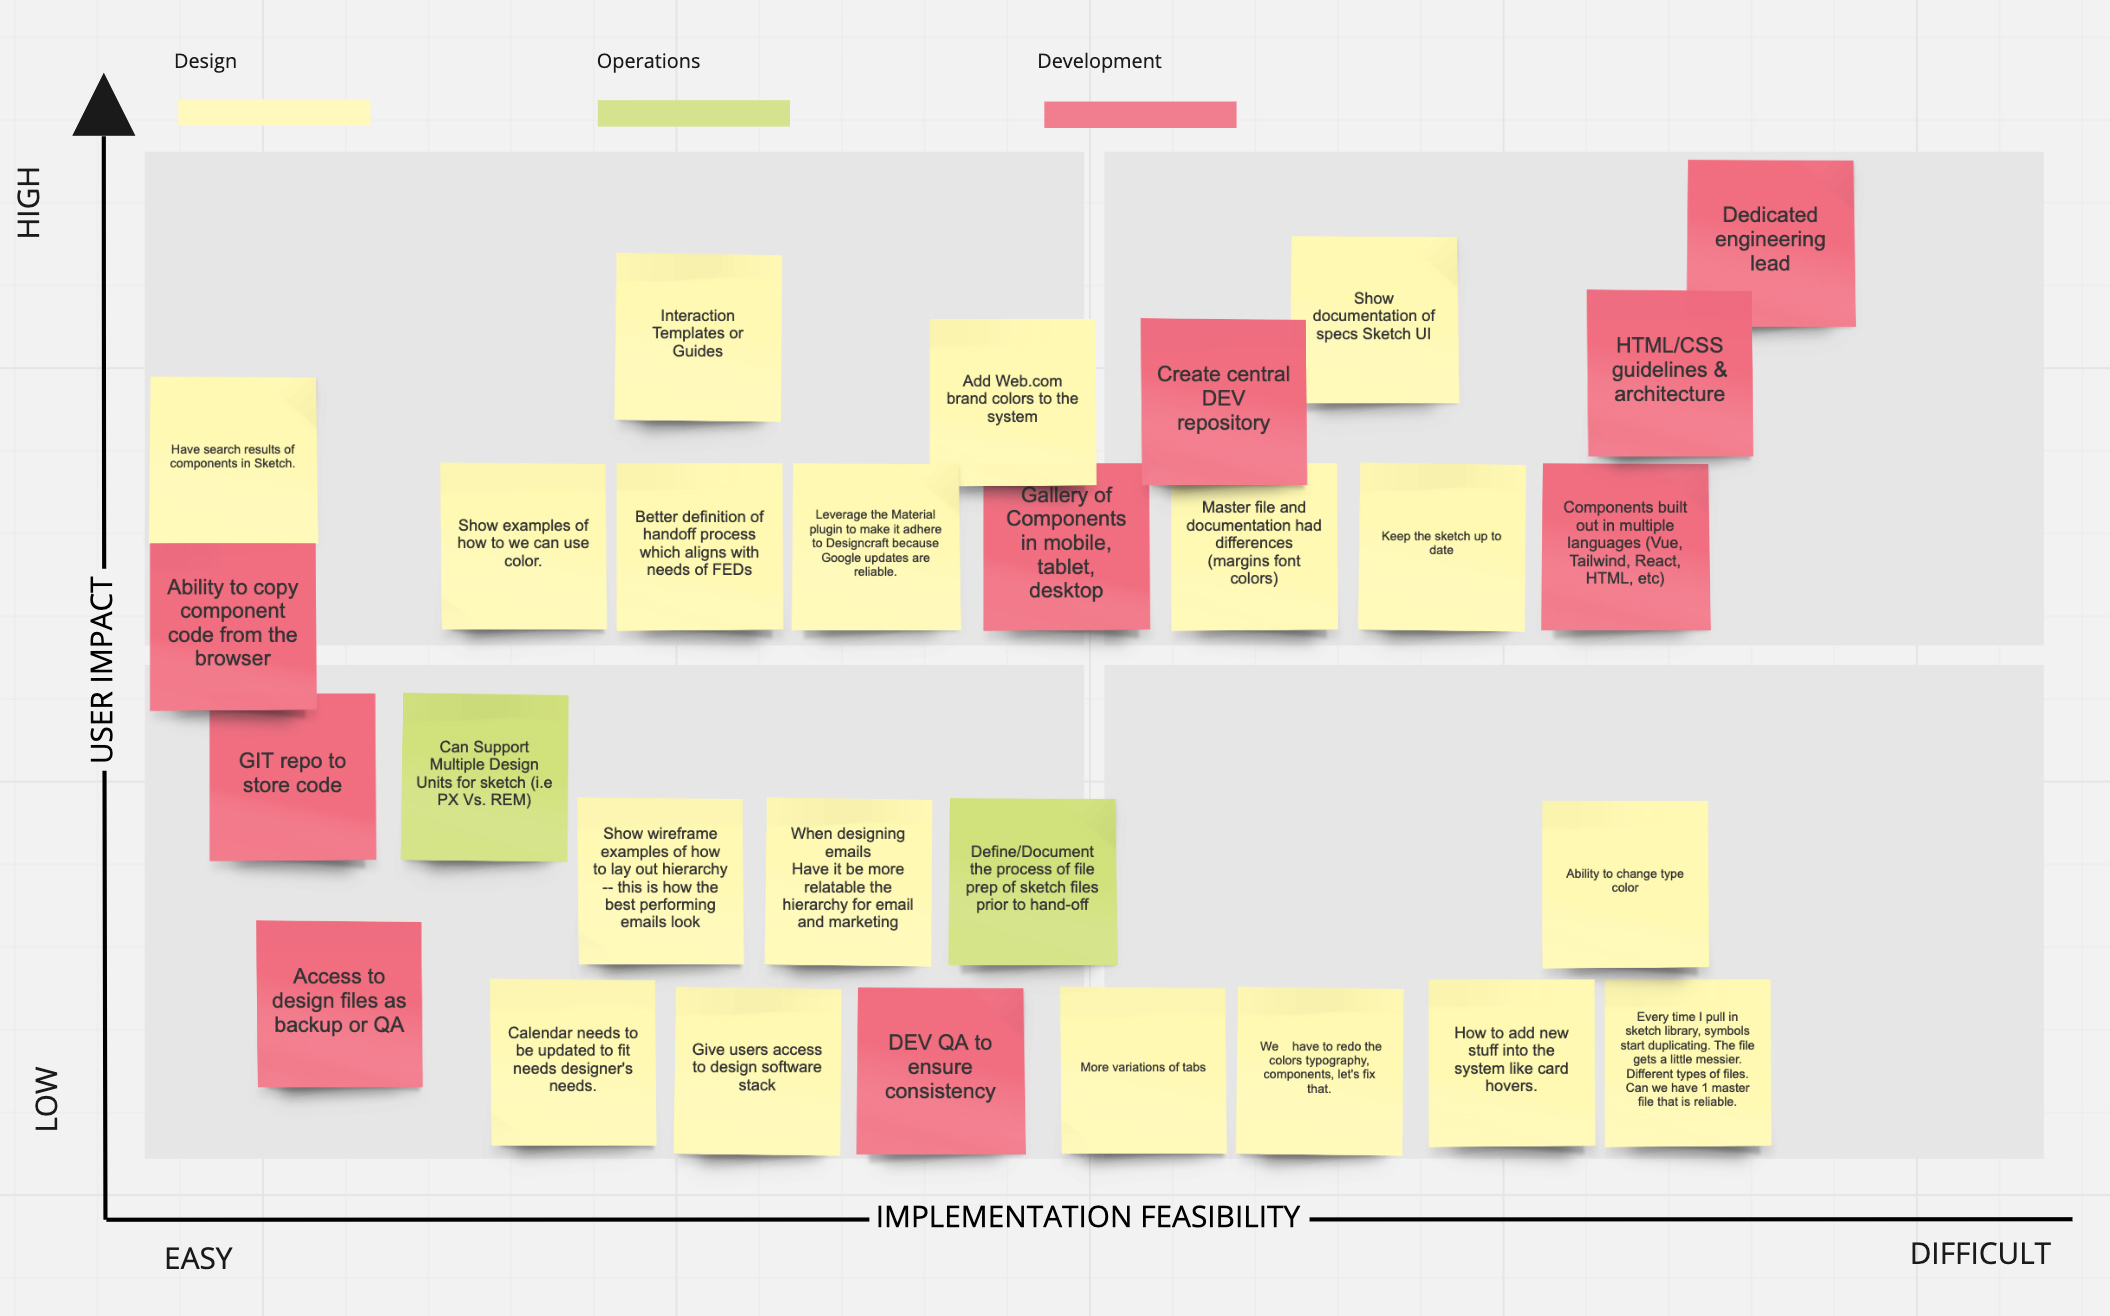
I facilitated an Eisenhower matrix workshop to prioritized tasks.
The Eisenhower matrix workshop produced a visualization of tasks which showed the effect on our users vs implementation feasibility.
I used Trello to create a roadmap for the MVP of Designcraft.
Swim lanes were used to help visualize our individual contributors’s tasks and progress.
Documentation guidelines of Designcraft.
I created a check list to show the progress of each Designcraft element.
Outcome
We have more consistency across the company, and we have more time to think about higher order problems. There is now a centralized design system team which is a support system to the other teams. The system team collects qualitative data to measure the effectiveness of the Designcraft, and to date, Web.com is benefiting.
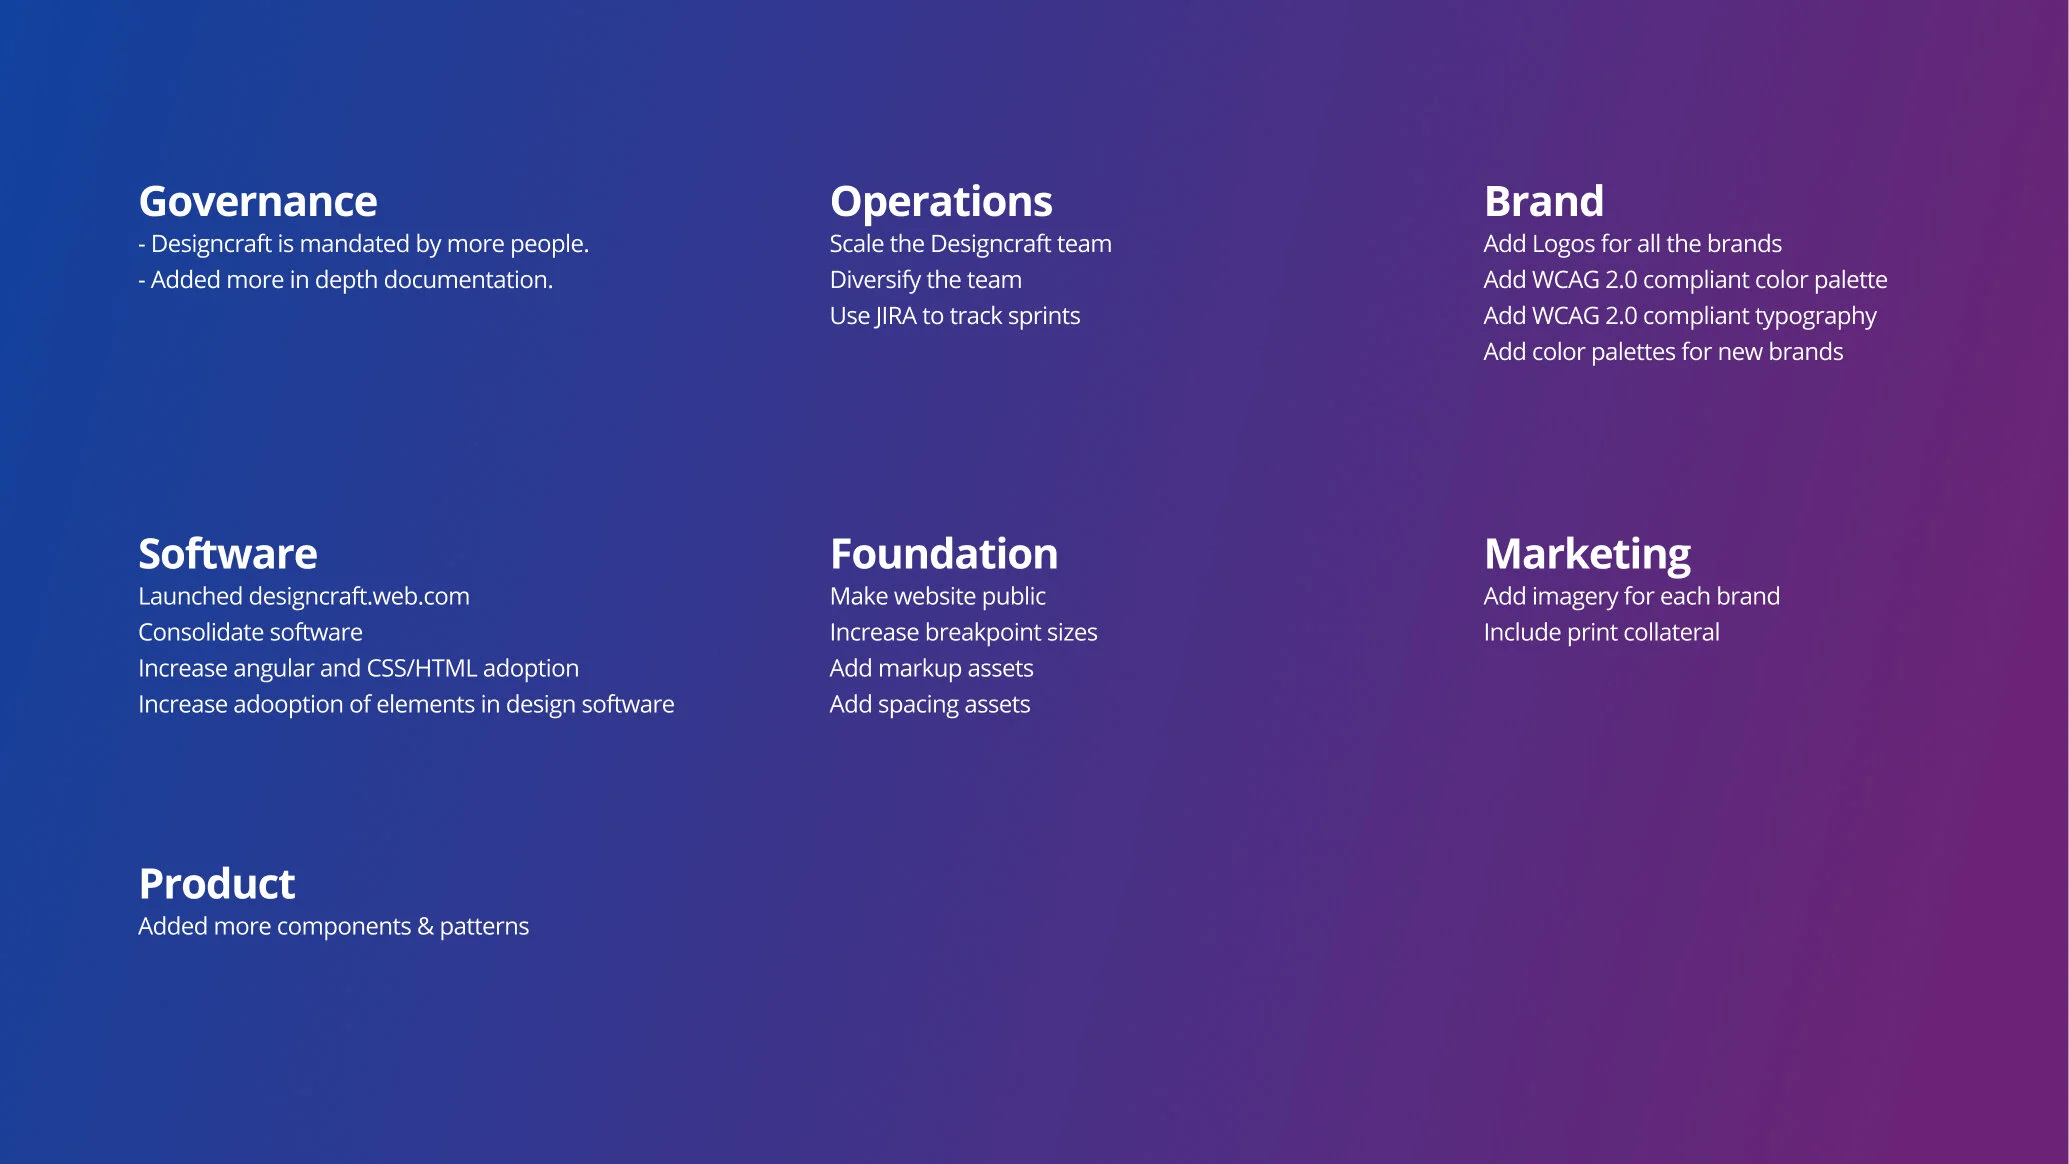
KPIs that boosted the effectiveness and credibility of the design system.

Example of a survey question that measured the Governance KPI.

A spider graph indicates system improvements that have been made and gaps in which require improvement.
“The direct impact is the DRY principle - don’t repeat yourself. Without (Designcraft) we will be rebuilding components over and over...which in-turn leads to more turn-around”
“It took the UI Guild 30 days to update the nav.
Now we have central space that renders nav updates, which takes 30 min”